Regional Cost Dossier
Venezuela Upstream — CAPEX Benchmark
€3,750 · one-time
Pay by card · immediate PDF delivery after payment
Report summary
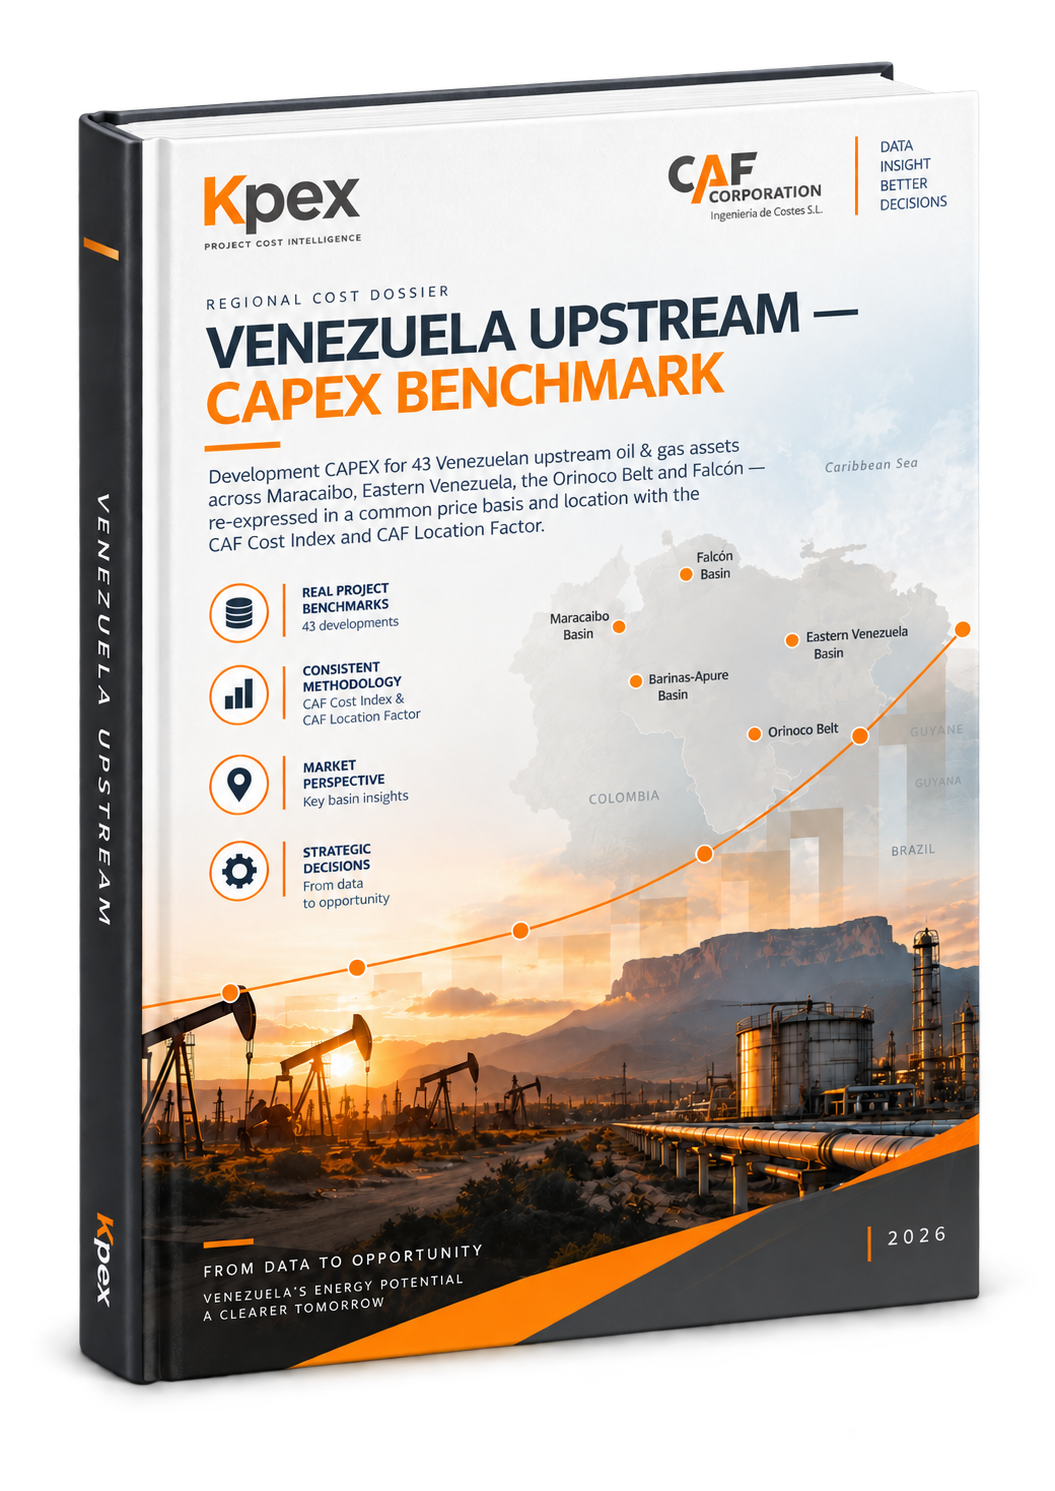
Development CAPEX for 43 Venezuelan upstream oil & gas assets across Maracaibo, Eastern Venezuela, the Orinoco Belt and Falcón — re-expressed in a common price basis and location with the CAF Cost Index and CAF Location Factor.
What's inside
Table of contents — 9 chapters
1Executive summary
2How the number is built
3Location Factor — Venezuela
4The benchmark
5Asset map — by basin
6CAPEX by functional unit
7The 43 developments
8Field profiles
9Data quality, referential fields & sources
Figures & charts — 3
- ▸CAPEX by basin (US$B, 2026)
- ▸Unit CAPEX (US$/boe, 2026) — P10 / P50 / P90
- ▸Benchmark cost curve (log-log, with project points)
Tables — 6
- ▪Table 1 — Venezuela location-factor drivers (Kpex Z.4): institutional and infrastructure drivers with source, rating and factor.
- ▪Table 2 — CAPEX by producing basin (2026 basis): number of fields and aggregate development CAPEX per Venezuelan basin.
- ▪Table 3 — Portfolio CAPEX by functional unit (2026 basis): aggregate development CAPEX allocated to functional units across the 43 assets (indicative Kpex allocation, DRAFT).
- ▪Table 4 — Asset register: the 43 Venezuelan upstream developments with basin, operator, gravity, recoverable reserves, escalated CAPEX and unit CAPEX.
- ▪Table 5 — Wood Mackenzie documents held outside the field-level benchmark, with the reason.
- ▪Table 6 — Principal sources.
What you get
📄 Branded PDF · A3
🎯 AACE Class 5 screening benchmark
📈 Live CAPEX·OPEX·ABEX lifecycle costing
⚡ Immediate download after payment
🔒 Proprietary — single-recipient licence